Chapter 17
Rich countries like Sweden have had populations that fell and superficially stabilized, but have had an inexorable rise in age of marriage, foretelling a demographic disaster due to outbreeding, while autism possibly follows as well.
One of my heroes we have lost recently has been Hans Rosling. He assembled an amazing amount of data about national statistics worldwide and posted the collection on the internet as gapminder.com. Alas I could not find it for a time, but it returned. Since his death, some of his other fans have curated it. I hope they continue for a very long time. It is very interesting to watch the statistics play out.
For about 30 years birth rates in rich countries have been somewhat below replacement levels and have been reasonably stable. That does not sound so scary. But is there any evidence that a fertility crash is sneaking up on us? Sure. Here is the experience of Sweden between 1955 and 2005 with the births per woman on the horizontal axis and age at first marriage on the vertical axis in figure 50.
I noticed that age at first marriage for Swedish women was rising inexorably. I wrote Dr. Rosling to point this out. He did not respond, but I think he got my message, because within a week he published a note pointing out that the age at first marriage for Arab women was rising, and he being Swedish.
One of the things I really like about Rosling is that at one point he made a general quit claim, saying anybody could use his data, proper credit given, for any purpose without further permission. Alas, I cannot find that note any longer.
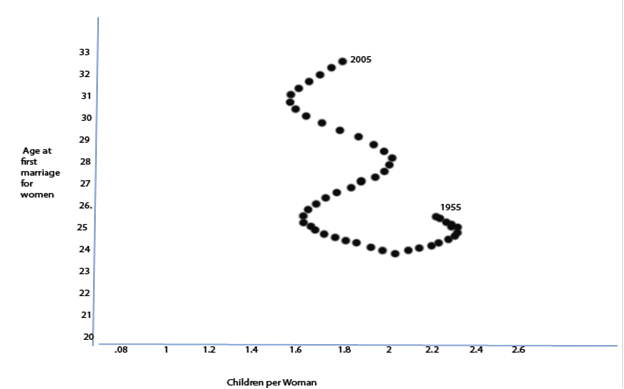
Experience of fertility and age at first marriage for women in Sweden by Hans Rosling as presented in Gapminder.com. Number of children per woman is along the horizonal axis. Age at first marriage for women is on the vertical axis. Each circle is one year, leading up to 2005. If you can find gapminder.com, it is very impressive to watch the world progress using the same axes.
Fig. 50 28
1955 is where the year label is. From there the trace wanders a bit but then fertility drops below 2 children per woman where it mostly remains. No sooner has the fall gone below replacement than the age at first marriage begins to rise. This is typical for developed countries; in some year, varying from country to country, fertility abruptly begins to fall, to go below replacement and then more or less to stabilize but with an immediate rise in age at first marriage for women.
Although fertility, as you can see here, may vary, that probably only means that couples are choosing to have their babies sooner or later. We have already seen, most clearly in Iceland and Denmark, that the actual total number of children is governed entirely by kinship issues.
On the other hand, once the marriage age starts upward, in the context of fertility below replacement, it never turns back. In fact, it never slows down. This is true of all the developed countries, and as we showed with the UN numbers, that means for the entirety of humankind that is visible in the statistics.
This give us the sad opportunity to determine when some country will suffer the fate of the Calhoun mice and experience total fertility collapse, again within the limits of what the statistics can show. I worked with gapminder until I could list years from 1975 to 2005 and the age of marriage in each year. It rose from 24 to 32 during those 30 years or about one year’s delay for 3.75 calendar years. The graph in figure 51 shows eloquently how implacable is the advance.
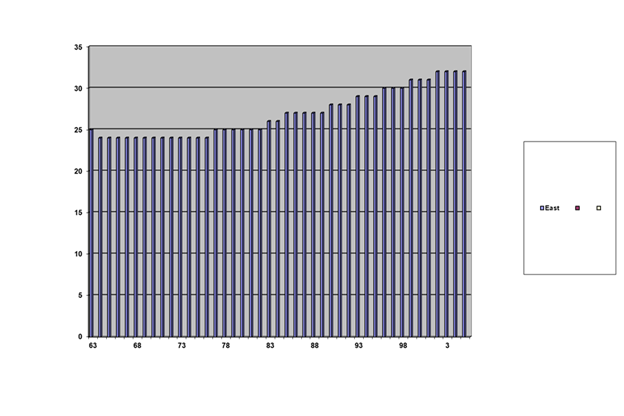
Inexorable rise of age at first marriage for Swedish women starting in the late 1970’s. Age is on the vertical axis. Year after 1900 is on the horizontal. Information drawn form gapminder.com.
Fig. 51 29
The raw numbers, year on the left and corresponding age at first marriage to the right.
1963 25
1964 24
1965 24
1966 24
1967 24
1968 24
1969 24
1970 24
1971 24
1972 24
1973 24
1974 24
1975 24
1976 24
1977 25
1978 25
1979 25
1980 25
1981 25
1982 25
1983 26
1984 26
1985 27
1986 27
1987 27
1988 27
1989 27
1990 28
1991 28
1992 28
1993 29
1994 29
1995 29
1996 30
1997 30
1998 30
1999 31
2000 31
2001 31
2002 32
2003 32
2004 32
2005 32
Assuming the pattern holds, the age of marriage in 2006 should be 33. I am making an assumption here that unmarried women are following the same trend as married women. If that is not true it could skew the results. I assume that by age 38 a woman’s ability to have children drops drastically as menopause approaches. And I am happy to leave out the statistics since 2005 since for several years there has been immigration into Sweden that again probably alters the actual numbers.
So, from age 33 to effective menopause would be 5 years. 5 times 3.75 is 18.75; we’ll call it 19. 19 plus 2005 is 2024. That should be the year that fertility collapses. And in our mostly global culture, and since just about everybody in Sweden is in the productive middle class, that probably holds for the productive middle class worldwide. It will be hard to maintain our high-tech civilization once the youngest productive people are fifty years old. One does run across reports that the most productive people in science are over 75, but eventually you are going to need some younger ones. The year 2074 may be a bad one. Harkening back to chapter 6, we roughly estimated that the rich world would have a fertility collapse between 2025 and 2045. The estimate and the range use, probably, different counts handled differently. We do not deserve to get two estimates so close together.
If rich world fertility will collapse in 2024, and the age of the last mother will be 38, she ought to be 34 now. Jumping back to the middle-developed world, which is estimated to be 35 years behind, she should be born in the next year; her pregnancy is already established, so that is going nowhere. The last estimate would put her at newborn. Again, two estimates are so close as to make trying to reconcile them an idle task.
That leaves only babies from Sub-Saharan Africa and maybe Afghanistan, with the numbers and diversity far greater in Africa. So those Black babies our racist leaders who want to save the world by reducing fertility are attacking our last hope of survival. How realistic is that hope? Well the least developed world is following the middling world by an estimated 20 years. So, the last woman of all who will have a baby will not be born for 20 years. Her parents will have fallen in love when they were 14. So, the cutoff for fertility is not when a woman reaches menopause or even when she is born. It is when her parents decide to get married or rather when they fall in love. Their limit is six years less than the middling developed countries. You have fourteen years to persuade them to continue to marry cousins or rather resume. But you will have to compete with “philanthropists” wanting to give them access to birth control. That won’t impact the birth rate. But some forms of birth control are a lot better than others. Their efforts could not be more misguided.
Then you have missionaries to contend with. They come in two flavors, Christian and Muslim. There are differences between them that are important to them if not important particularly to biology. There are also some similarities. They are very brave, willing to risk their lives in places you would not want to send an army. They teach very sophisticated religious and moral principles. And they want to get their faithful to renounce their loyalty to their village – creepy gods, at least recent cruelty, old fashioned and unable to offer things like hospitals – and become loyal to the broader horizon of the preferred faith. One can only admire them for their virtues, but they do have a problem they do not recognize.
Every time I run these numbers, I come up with different predictions. Let’s hope I’m terribly wrong in detail.
I have no cure in mind. Maybe cloning will become cheap and safe. Some other fix might be discovered if we were to search diligently. But a simple change in mating strategy does not appear to be promising; those last fertile women in the rich and middling world are already among us and many have already chosen their permanent partners. The take home message is that rich societies, like Sweden, are perilously close to disastrous infertility and demographic collapse with the rest of the world following in lock step not many years behind.
The outlook for fertility in the rich world is based on lots of data with good numbers. Autism lacks good numbers and I must be less dogmatic.
For my purposes, autism is only another form of infertility; it is marked by a failure in social development. I only found statewide incidences of “autism” for 11 states and that only for a recent year (currently, see healthline.com/health/autism/autism-rates-by-state#1. My original source has vanished, and of course numbers will change.) viz:
autism incidence urban population ratio
Alabama. .49 1 in 175
Arizona. .898 1 in 64
Arkansas. .562 1 in 64
Colorado. .862 1 in 101
Georgia .751 1 in 64
Maryland .872 1 in 60
Missouri .704 1 in 70
New Jersey .947 1 in 46
North Carolina .661 1 in 53
Utah .906 1 in 54
Wisconsin .702 1 in 108
So, I worked out this graph, figure 52:
Urbanization against incidence of autism. The vertical axis is the proportion of the state living in cities. The horizonal axis is the incidence of autism as the fraction of children with autism spectrum disorder. The graph is upside down compared with intuition because this is a reciprocal function in that higher numbers in the vertical axis mean lower degrees of urbanization.
Fig. 5230
In this chart the left-hand column indicates incidence of autism for select states and pulled from the internet. This is a reciprocal function in that higher numbers mean lower incidence. The rows indicate proportion of the population living in cities in these same states, ranging from 0 for none to 1 for everybody. The horizontal axis is the fraction of children with the disorder. It looks like the trend line will cross “1” where everybody is urban at about 30 or roughly 3% of the population having autism spectrum disorder. Whether that number will change over time is not evident from the data I have. At all events it appears that the greater the proportion of people living in cities, the more autism.
Of course, we would much prefer to have good numbers for every state gathered over several sequential years. Ah, Hans. Where are you when we need you?
On the face of it, a reasonable and prudent person would think that the cause of urban autism is the same as the cause of urban infertility, which I think the evidence establishes beyond all doubt that this is due to failure to marry cousins closer than about 7th is the major cause of infertility.
So, there you have a possible cause of autism spectrum disorder in hand. The prevention ought to be marrying sufficiently close cousins or have sufficiently closely related donors in the case of medically assisted fertility. There are people working on the neuroanatomical changes in the condition, in effect looking for a pill for autism. One can only wish them well.
Just because we know the correlation and possibly the cure does not mean we understand the mechanism. One could possibly argue that the condition is caused because the brain, with its fabulous complexity, is developed under the influence of many genes. In the absence of sufficient kinship, possibly one gene is trying to build one brain while other genes are working as if on other brains. This might come out of current research.
Chapter 18
Table of Contents
Home page